
In short
Spend analysis organises all of a company's external spend by category, supplier, plant and contract and shows where savings potential and risk sit. Traditionally it focuses on the largest items, because there is no capacity for more. With AI, the entire portfolio can be analysed regularly. What then matters is not savings alone but the share of spend under active management.
Data: third-party research with source. Our view: the joint position of H&Z and Elevatry, indicative observations from project work. Model: calculations and examples, not customer results.
01Argument
Pareto allocates attention, not value.
ABC analyses, portfolio matrices and Pareto cuts pass for analytical tools. In practice they are rules for allocating scarce expert time. The largest categories get cost models, multi-round tenders and carefully prepared negotiations. Everything else is renewed, re-ordered and re-approved.
That was rational while every analysis cost days. But it has a side effect: the rule confirms itself. Where nobody looks, no potential is found, so the rest is deemed unproductive, so nobody keeps looking. The 80/20 split then describes not where the value is, but where the time goes.
When the price of analysis changes, so does the calculation. Once Companions take on much of the knowledge-intensive analysis, reviewing the whole portfolio becomes affordable. The question is no longer which suppliers you can afford to look at, but which ones you can afford to overlook.
02Argument
Unmanaged value hides in plain sight.
The value outside the top suppliers rarely sits in one big find. It sits in many small patterns: six prices for one specification from six suppliers. Index clauses never invoked in the buyer's favour when raw material prices fall. Auto-renewals because nobody worked the notice period backwards. Price differences between plants that persist year after year.
Each case on its own is minor. Together they form a structural leak that no savings programme reaches, because none had the capacity to look. A spend analysis that only sorts volumes will not find these patterns. For that, invoice lines, specifications and contract clauses have to be read together.
Model. Assumptions: €500M spend, of which €200M is not actively managed. Price spread 1.5% on €60M; index decline of 4% on €40M, half not passed on; 3% on €30M of auto-renewed contracts; plant gap 2% on €50M.
What gets reported as a savings gap is often a coverage gap.
03Argument
Measure coverage, not only savings.
Savings and cost per purchase order say little about how much of the portfolio is actually shaped. The fitting measure is managed-spend penetration: the share of external spend that receives expert-grade attention at each decision point. Spend counts as actively managed when it has a current strategy with defined levers and has been part of a structured sourcing or negotiation event in the last 24 months. According to Ardent Partners, 71% of spend is under active management on average; every additional euro brought under management saves 6 to 12% in the first contract term.
The measure makes the coverage gap visible and changes the conversation in the boardroom. What gets measured gets staffed, by people or by machines. Next to it belongs realised value per euro of spend, so that coverage is not confused with activity.
More coverage on its own is not enough. AI without procurement method produces more analyses with average reasoning, and that is risky in a negotiation. Only when the method the top categories get today is applied to the rest of the portfolio do coverage and quality rise together.
Companions for this topic
What Elevatry does for you.
Companions work around the clock in your data, with the H&Z method from more than 5,000 procurement projects. They prepare decisions, work in your experts' feedback and, once you approve, carry out the next steps. Your team decides.
Worked example
ModelSix prices for one standard part
A manufacturer buys pneumatic fittings and standard parts worth €2.4M a year for four plants from 23 suppliers. The category has no owner. Orders go through free text and old framework agreements.
- 01Classify
The Companion maps about 9,800 invoice lines to 310 specifications. A third of the lines had no material number.
- 02Compare prices
The same specification is bought at up to six different prices. The median spread between cheapest and most expensive is 18%.
- 03Read the contracts
Two framework agreements renew automatically. For one of them, the notice period ends in ten weeks.
- 04Value it realistically
The benchmark is the second-cheapest price per specification, not the cheapest. That yields about 11% of volume, without assuming any change of supplier.
- 05The category manager decides
Whether to bundle, steer through a catalogue or first just renegotiate is a human decision, made with plants and supply in mind.
About €0.26M a year in a category nobody had worked on, and an auto-renewal that can be stopped in time.
Illustrative, not a customer result.
For your next leadership meeting
Questions worth asking.
- 01
What share of our spend has a current strategy with defined levers, and what share is simply renewed?
- 02
How many different prices do we pay today for our ten most frequent specifications?
- 03
Which index clauses would have worked in our favour in the last twelve months, and who invoked them?
- 04
Do we report savings or coverage to the board, and what would change if we reported both?
Free download
Practical guides on this topic
The Elevatry guides take the topic into day-to-day work: as a PDF, free of charge.
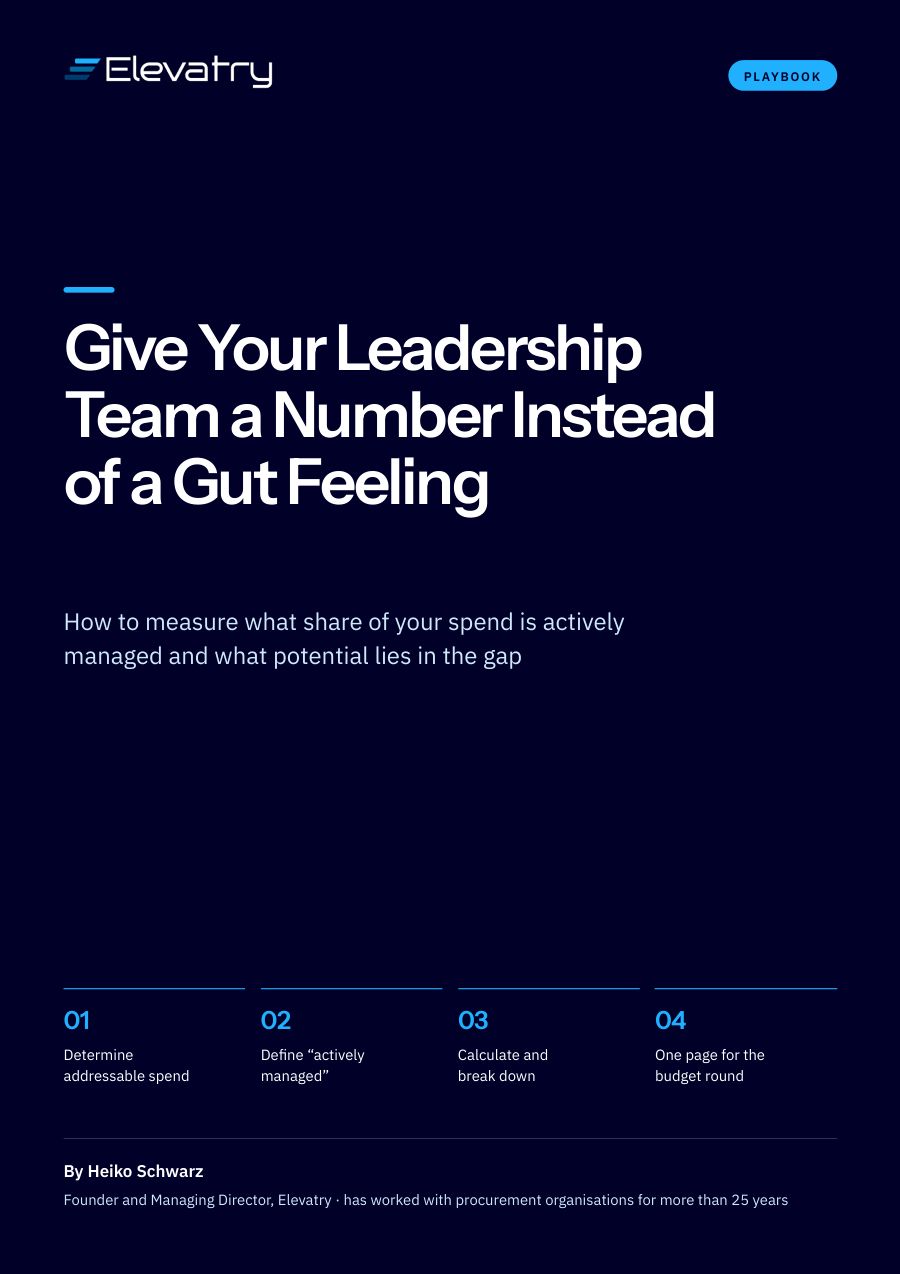 Give your leadership team a number instead of a gut feelingCoverage instead of the savings list: four steps to the KPI that shows what share of addressable spend is actively managed – and what potential lies in the gap.Download for free
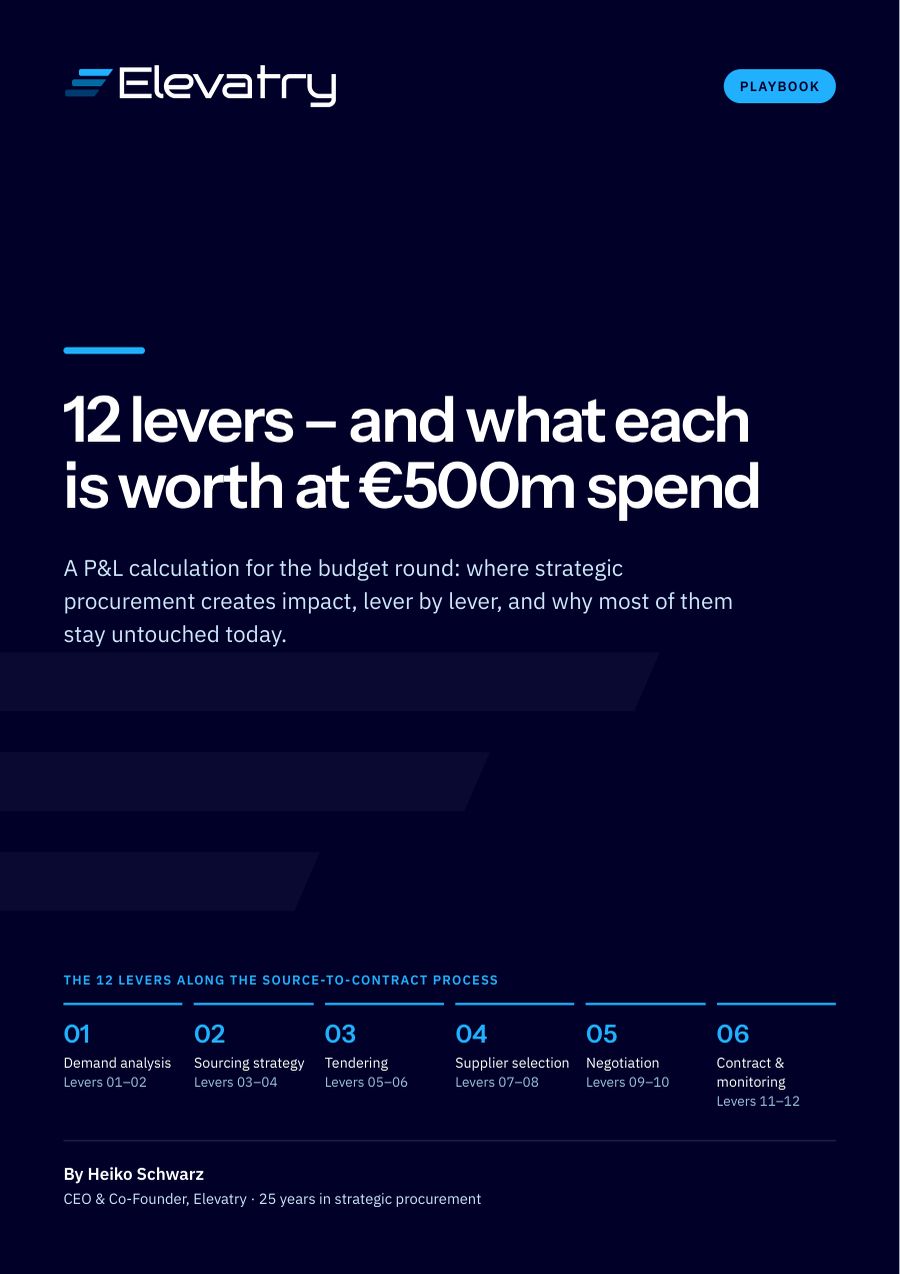 12 levers – and what each is worth at €500m spendWhere strategic procurement creates impact, calculated lever by lever along the source-to-contract process – and why most of them stay untouched today.Download for free
FAQ
What procurement leaders ask us.
What data does AI need for a spend analysis?
How much can an AI spend analysis realistically save?
Do we need a master data project before an AI spend analysis?
Which KPI shows the board how much spend procurement actually manages?
Is spend analysis worth it for C-parts and small suppliers?
Read on